

相信許多物理教師在編講義或出考卷時,遇到最麻煩的問題就是畫圖了。以下幾個軟體是我試用過之後覺得蠻好用的:
這 幾個軟體不論是在Linux還是Windows上都可以運作,其中前三個軟體是freeware,而QCad則是要註冊的( USD 33 ~ NT 1094)。gnuplot主要是用來畫函數圖形,inkscape是類似corle-draw的向量繪圖軟體,OpenOffice是一套相當有名的辦 公軟體,而QCad則是類似Auto-Cad的繪圖軟體。在這邊我先介紹gnuplot。

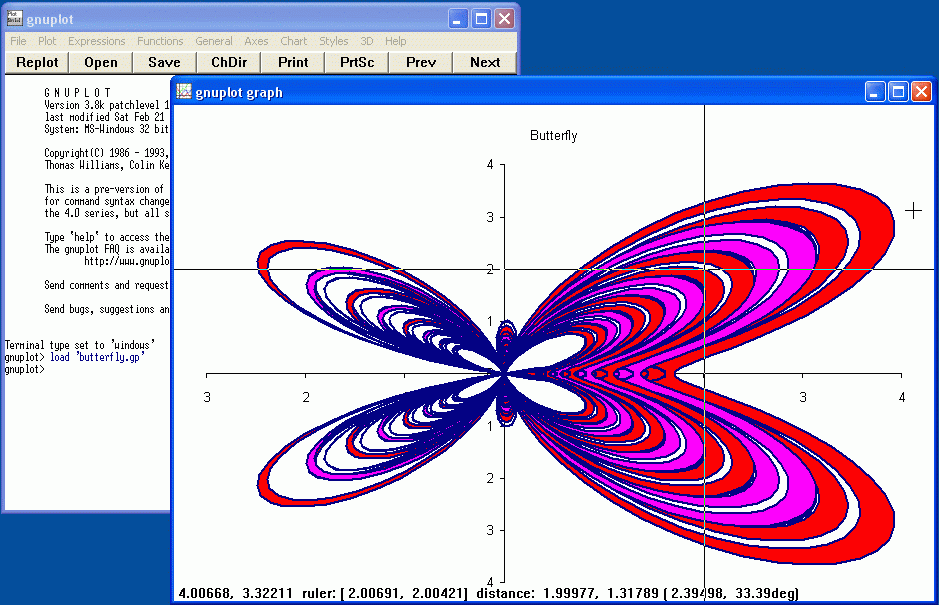
gnuplot在Windows的介面如下圖(取自gnuplot homepage)
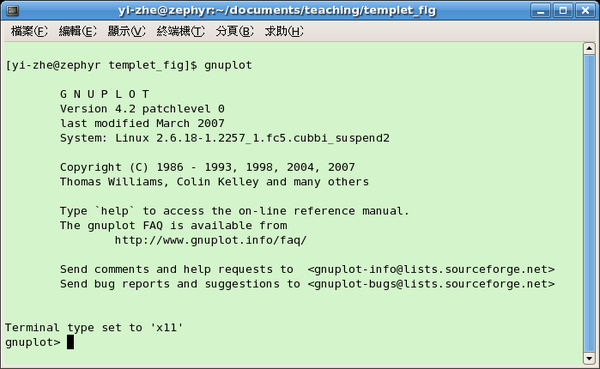
我在FC5下則是直接用文字介面
可以直接在文字介面中執行
$ gnuplot
進入gnuplot,然後在裡面直接打指令畫圖。但也可以執行
$ gnuplot [command file]
直接執行寫在command file中的指令。我個人是比較偏好第二種方法。
以底下這張圖為例:(因為怕svg檔無法正常顯示,底下這張圖是png檔)
我的指令檔如下
gnuplot在Windows的介面如下圖(取自gnuplot homepage)
我在FC5下則是直接用文字介面
可以直接在文字介面中執行
$ gnuplot
進入gnuplot,然後在裡面直接打指令畫圖。但也可以執行
$ gnuplot [command file]
直接執行寫在command file中的指令。我個人是比較偏好第二種方法。
以底下這張圖為例:(因為怕svg檔無法正常顯示,底下這張圖是png檔)

我的指令檔如下
set xrange [0:2*pi]
set yrange [-1.1:1.1]
set title "x-t plot"
set xlabel "t (sec)"
set ylabel "x (m)"
# 顯示x軸
set xzeroaxis
# 不顯示圖例
set key off
# 加上三條直線
set arrow 1 from pi/2,1.05 to pi/2,-1.05 nohead ls 3
set arrow 2 from pi,1.05 to pi,-1.05 nohead ls 3
set arrow 3 from 3*pi/2,1.05 to 3*pi/2,-1.05 nohead ls 3
# 加上標籤
set label 1 "1" at pi/4,0.1 center font "Times,24" textcolor ls 2
set label 2 "2" at 3*pi/4,0.1 center font "Times,24" textcolor ls 2
set label 3 "3" at 5*pi/4,0.1 center font "Times,24" textcolor ls 2
set label 4 "4" at 7*pi/4,0.1 center font "Times,24" textcolor ls 2
# 設定輸出為svg檔
set terminal svg
# 設定輸出檔名
set output "x-t_sin.svg"
# 畫sin(x),0 < x < 2*pi
plot [0:2*pi] sin(x)
可以設定的輸出格式還有很多種,像是png, jpeg, gif, postscript等等。詳細的設定請參考gnuplot裡的help
您可以將以上的指令另存成一個檔案,例如 "sin-plot.gnuplot" ,然後在指令列裡直接下指令
$ gnuplot sin-plot.gnuplot
就會自動把以上的指令執行完
沒有留言:
張貼留言